



Sales Gantt Chart Excel Template | Sales Pipeline Tracker, Activity Planner, Dashboard, Timeline & CRM Spreadsheet | Instant Download
Sales Gantt Chart Excel Template | Sales Pipeline Tracker & Activity Planner | Dashboard, Timeline & CRM Spreadsheet | Instant Download | EASY TO USE
Plan, track and present your whole sales pipeline in one Excel file - and the Gantt timeline draws itself.
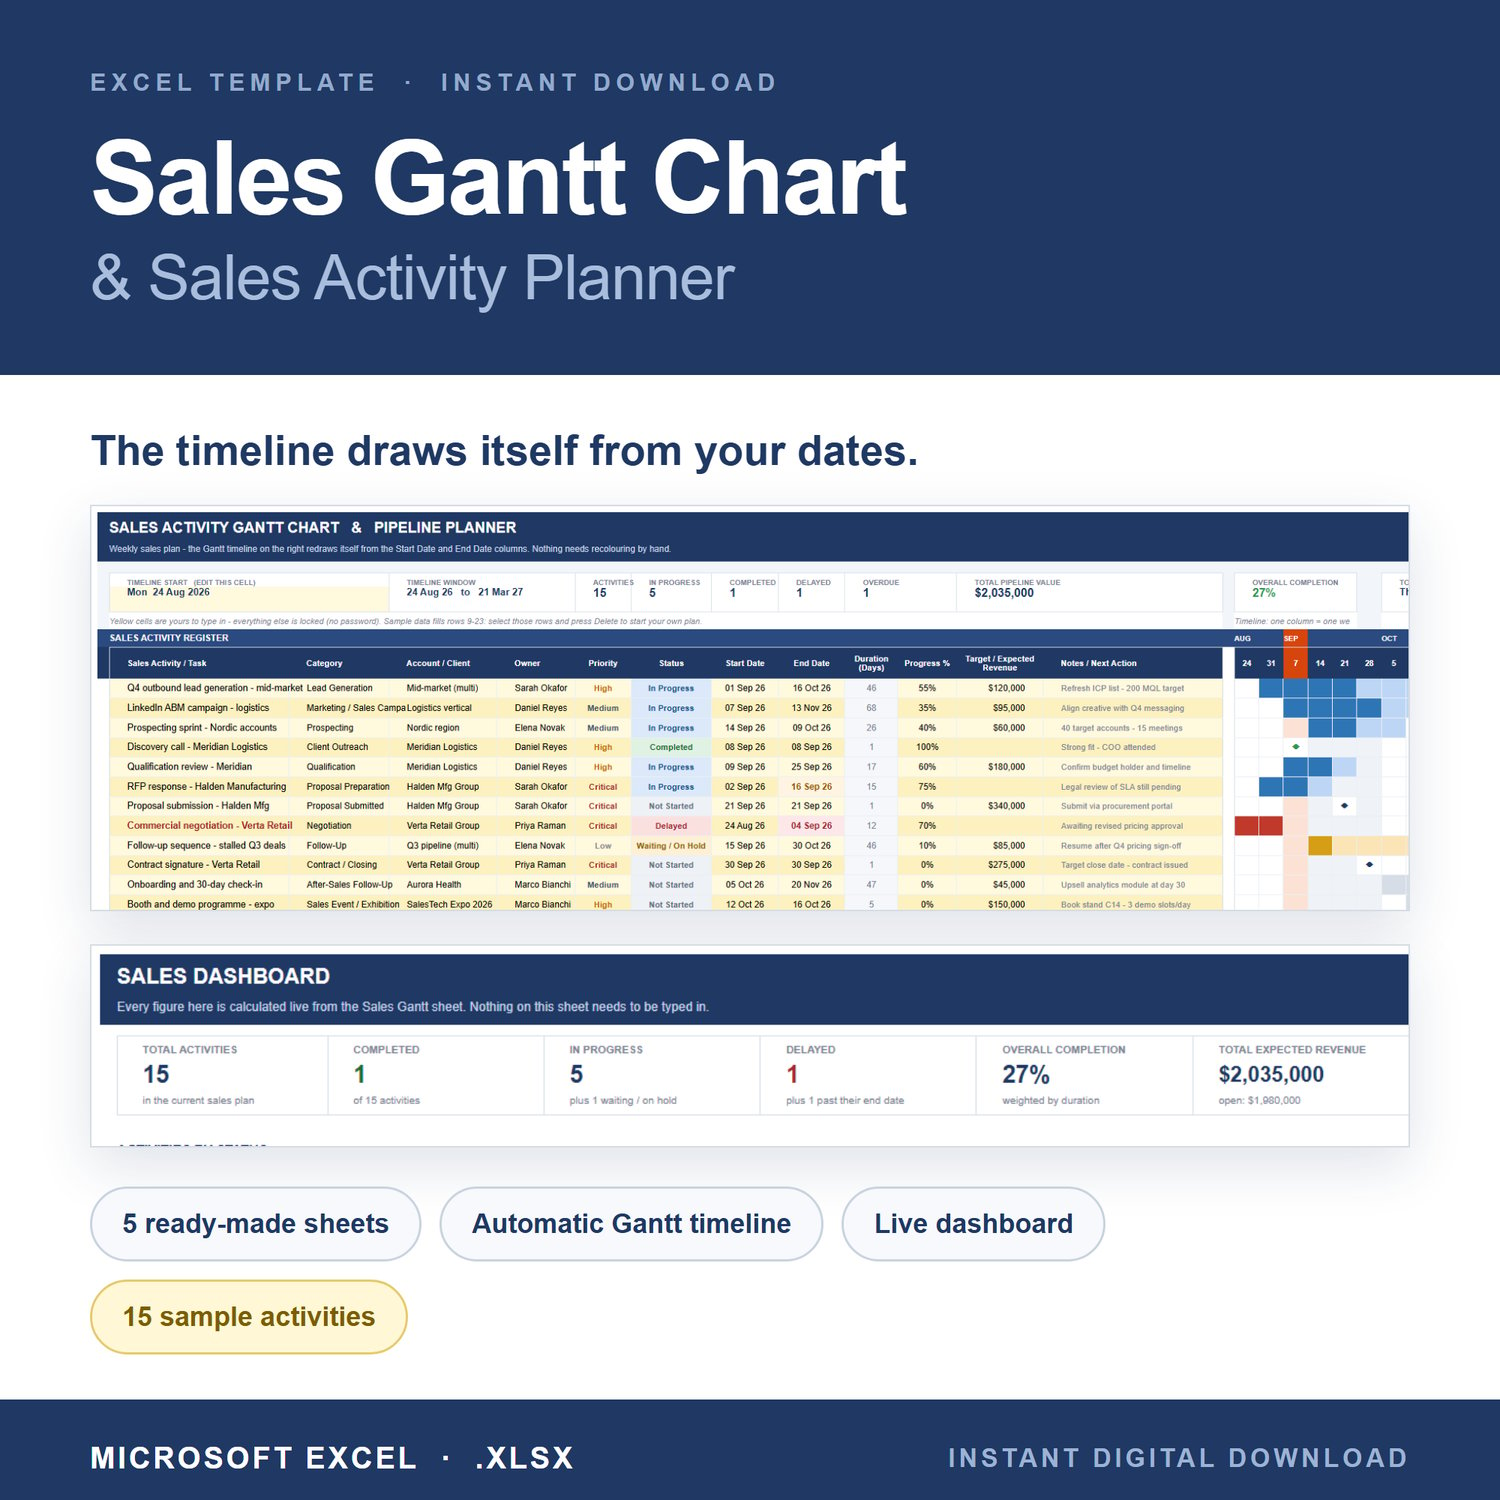
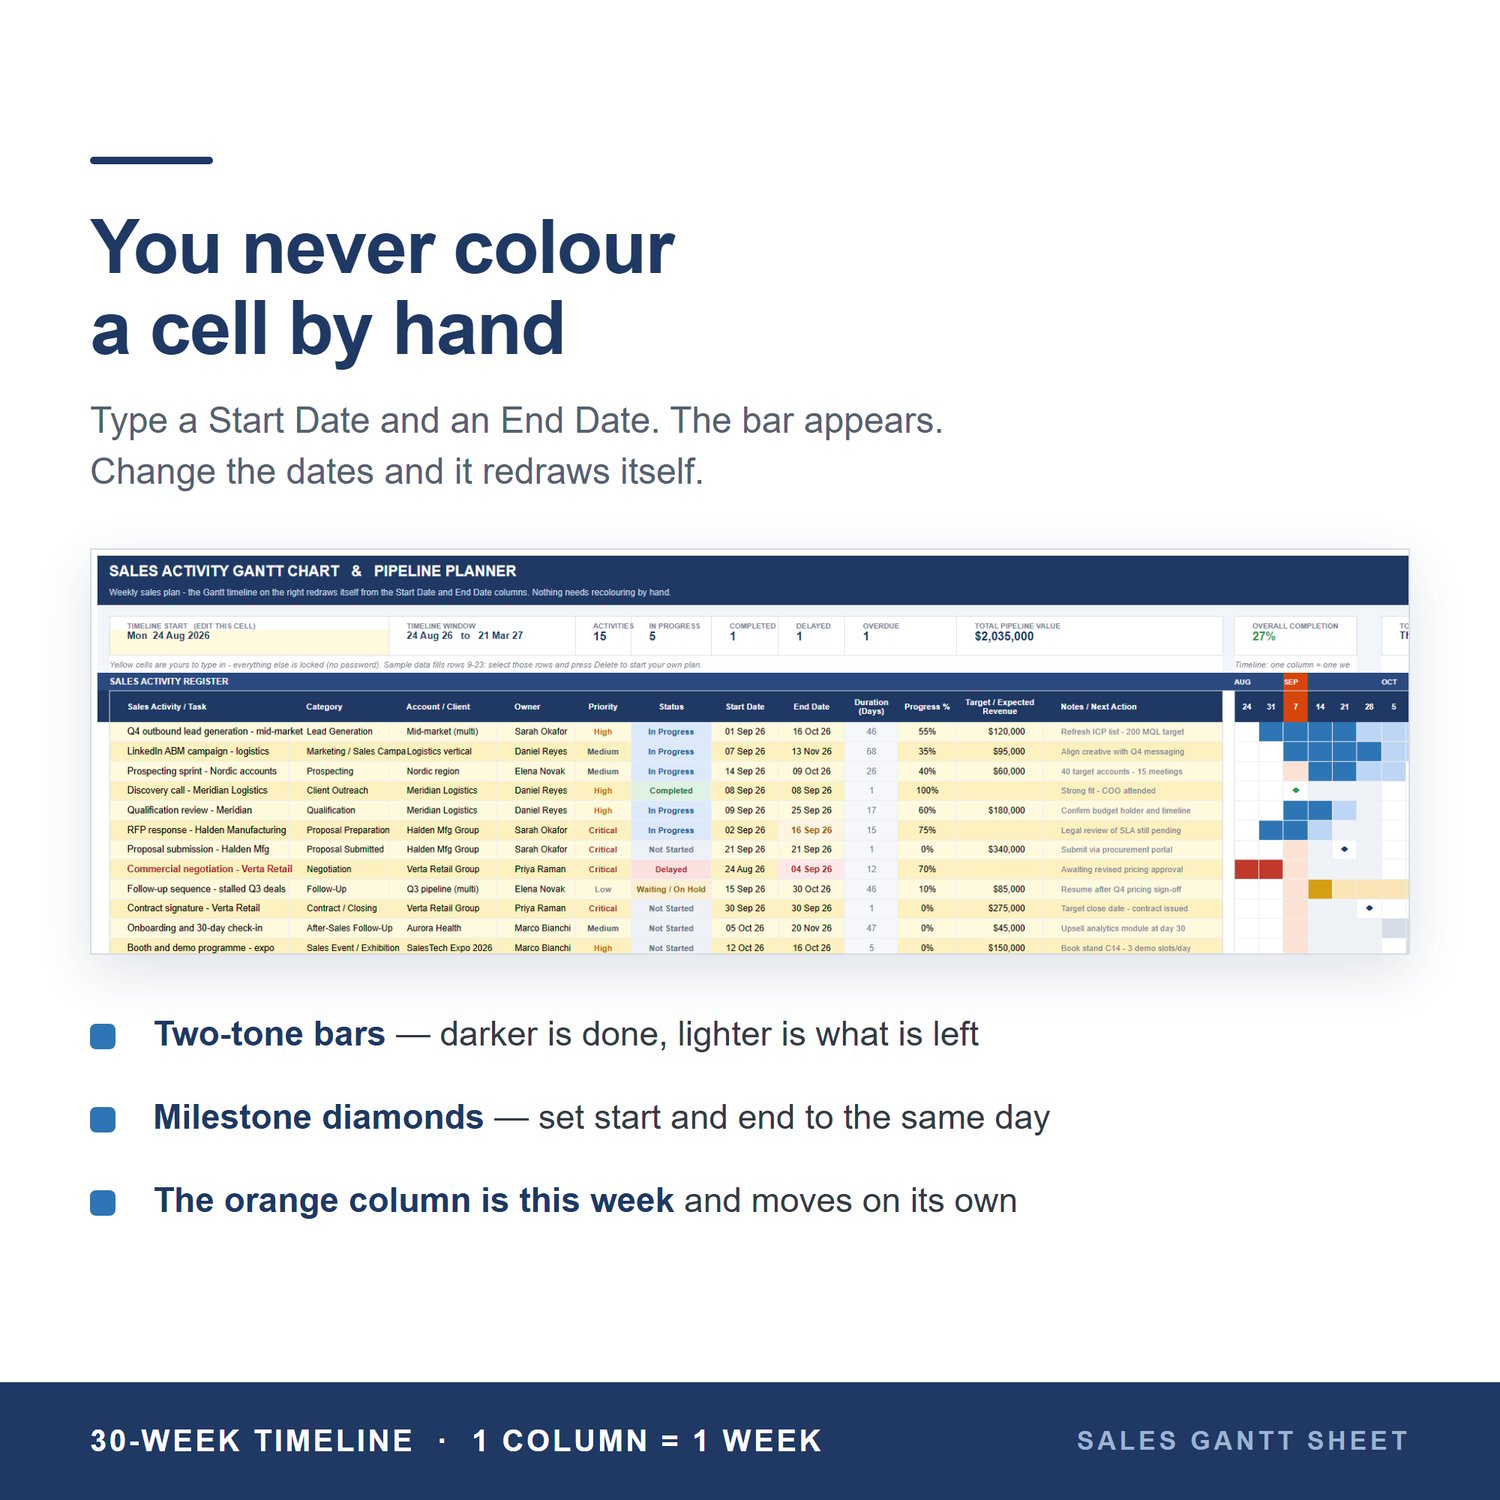
Type a start date and an end date. The bar appears. Change the dates and it redraws. You never colour a cell by hand.
WHAT YOU GET
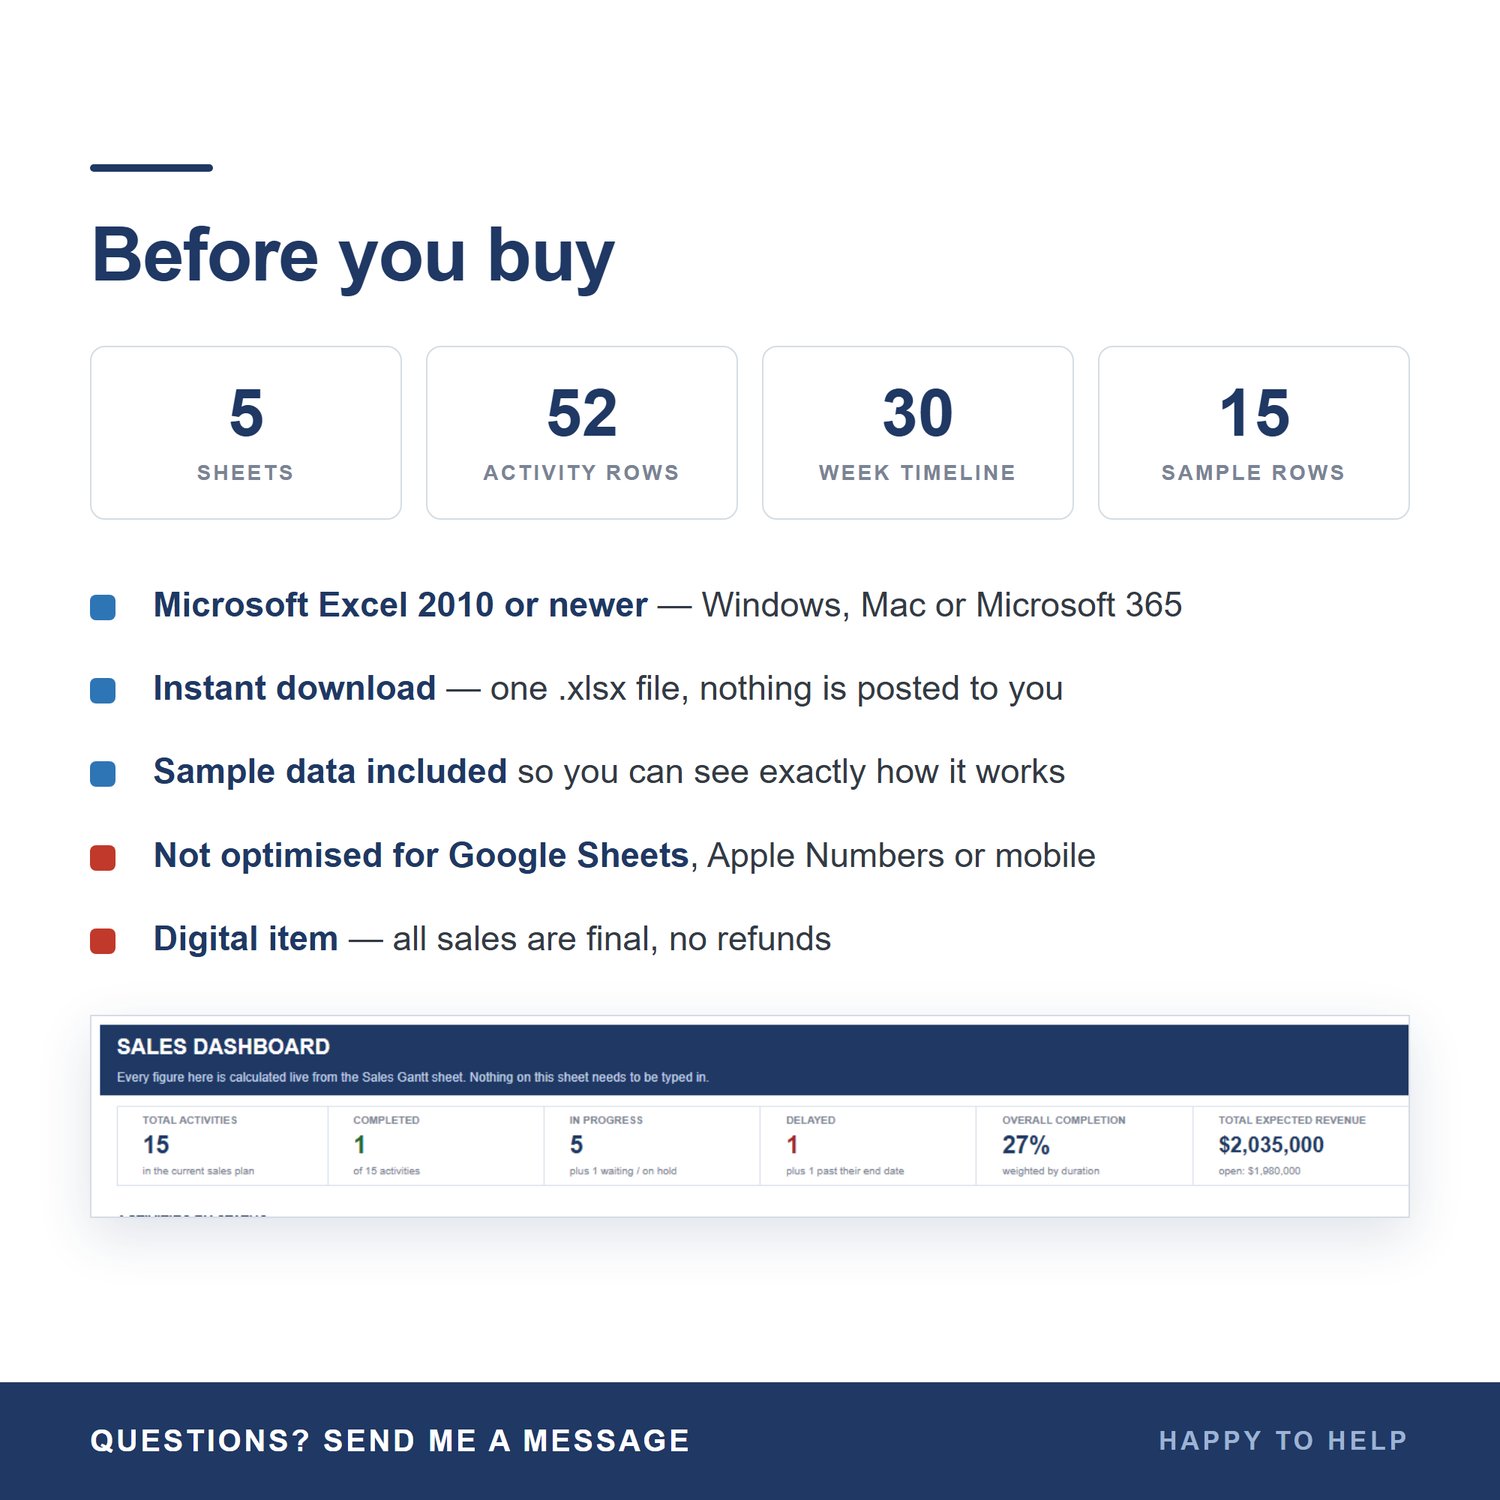
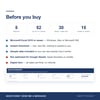
- 1 Excel file (.xlsx) with 5 ready-to-use sheets
- 15 realistic sample activities so you can see how it works straight away
- Room for 52 activities, instant download, yours to keep
WHAT'S INSIDE
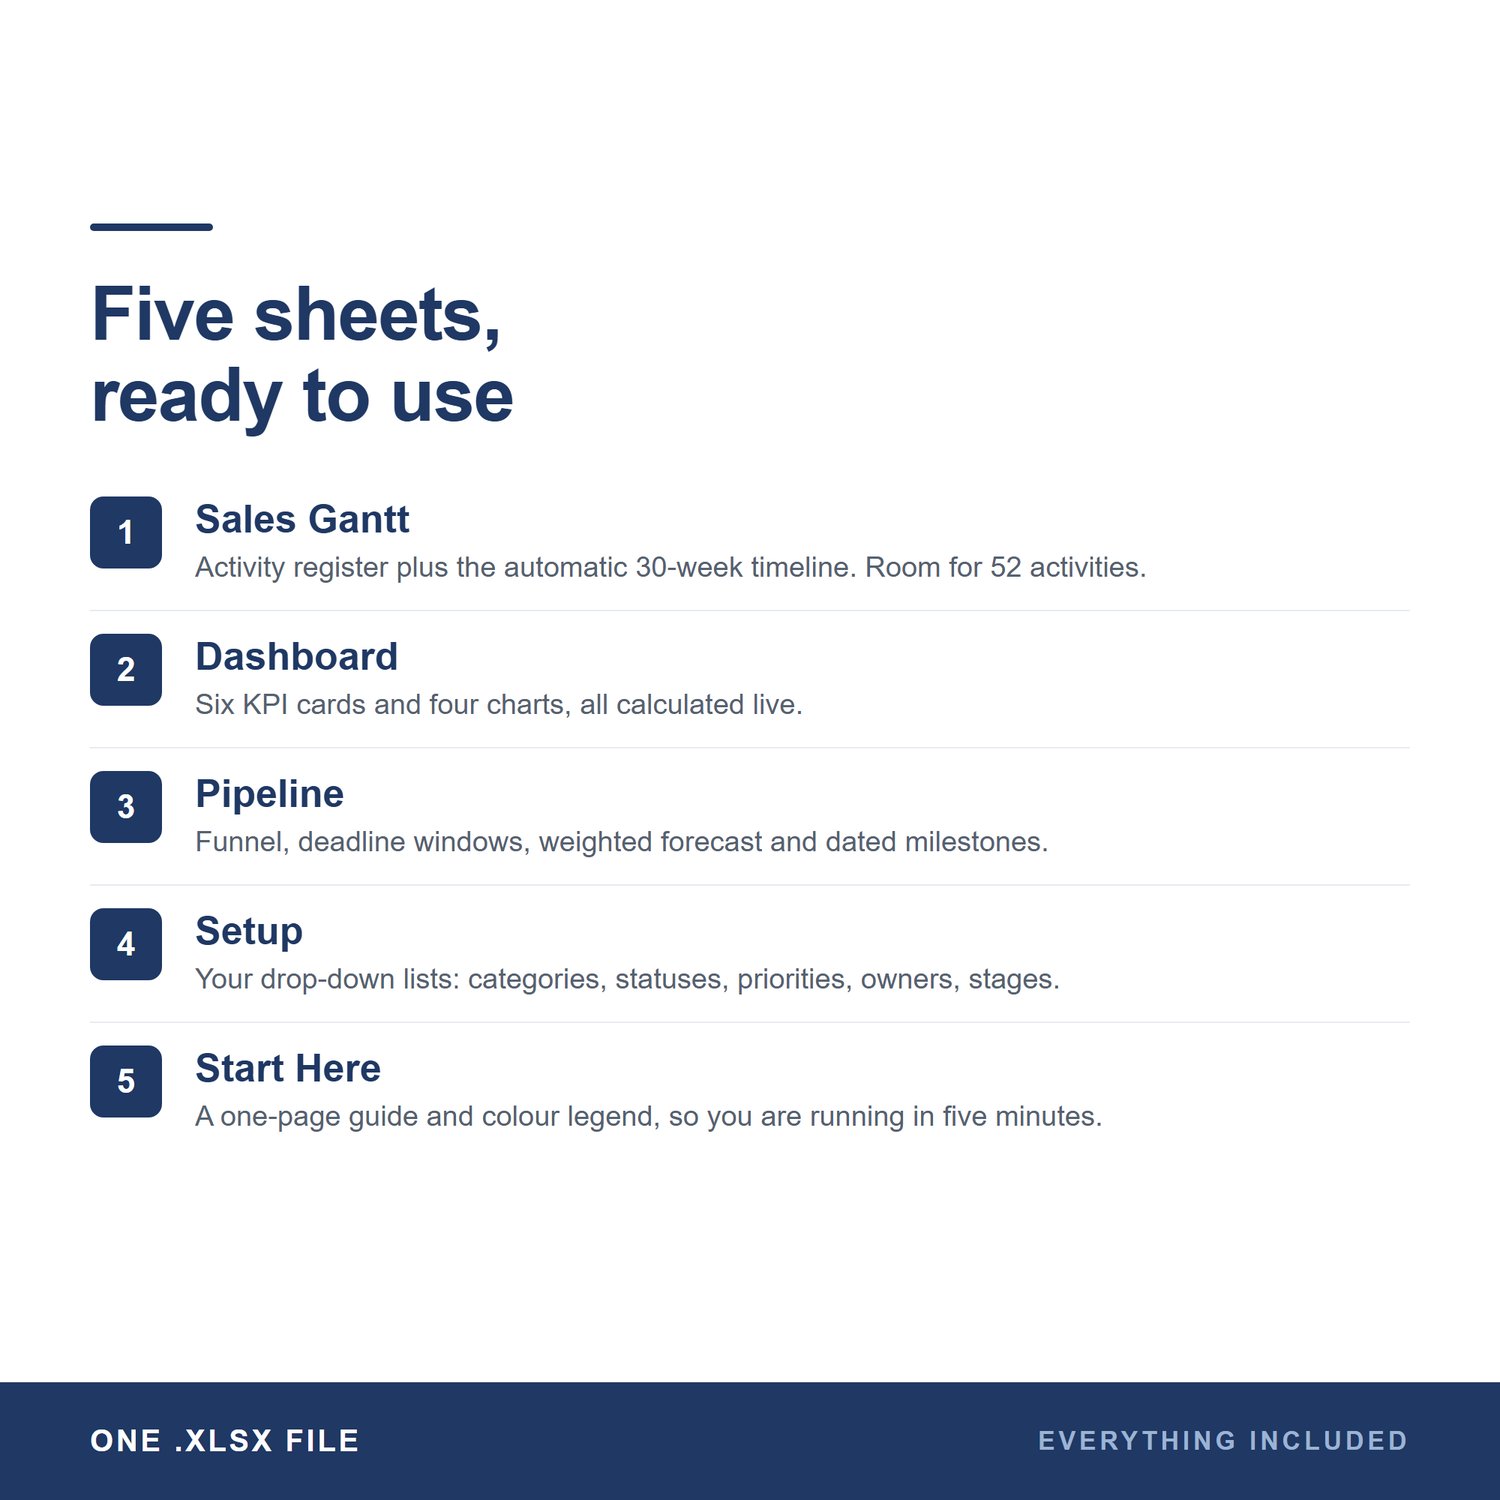
1. SALES GANTT
Your activity register plus an automatic 30-week timeline. One column = one week, with month headers and a marker on the current week that moves by itself. Bars are two-tone, so the darker part shows how much is done and the lighter part what's left. Set a start and end date to the same day and the row becomes a milestone diamond.
Columns: Sales Activity, Category, Account/Client, Owner, Priority, Status, Start Date, End Date, Duration, Progress %, Target/Expected Revenue, Notes/Next Action.
2. DASHBOARD
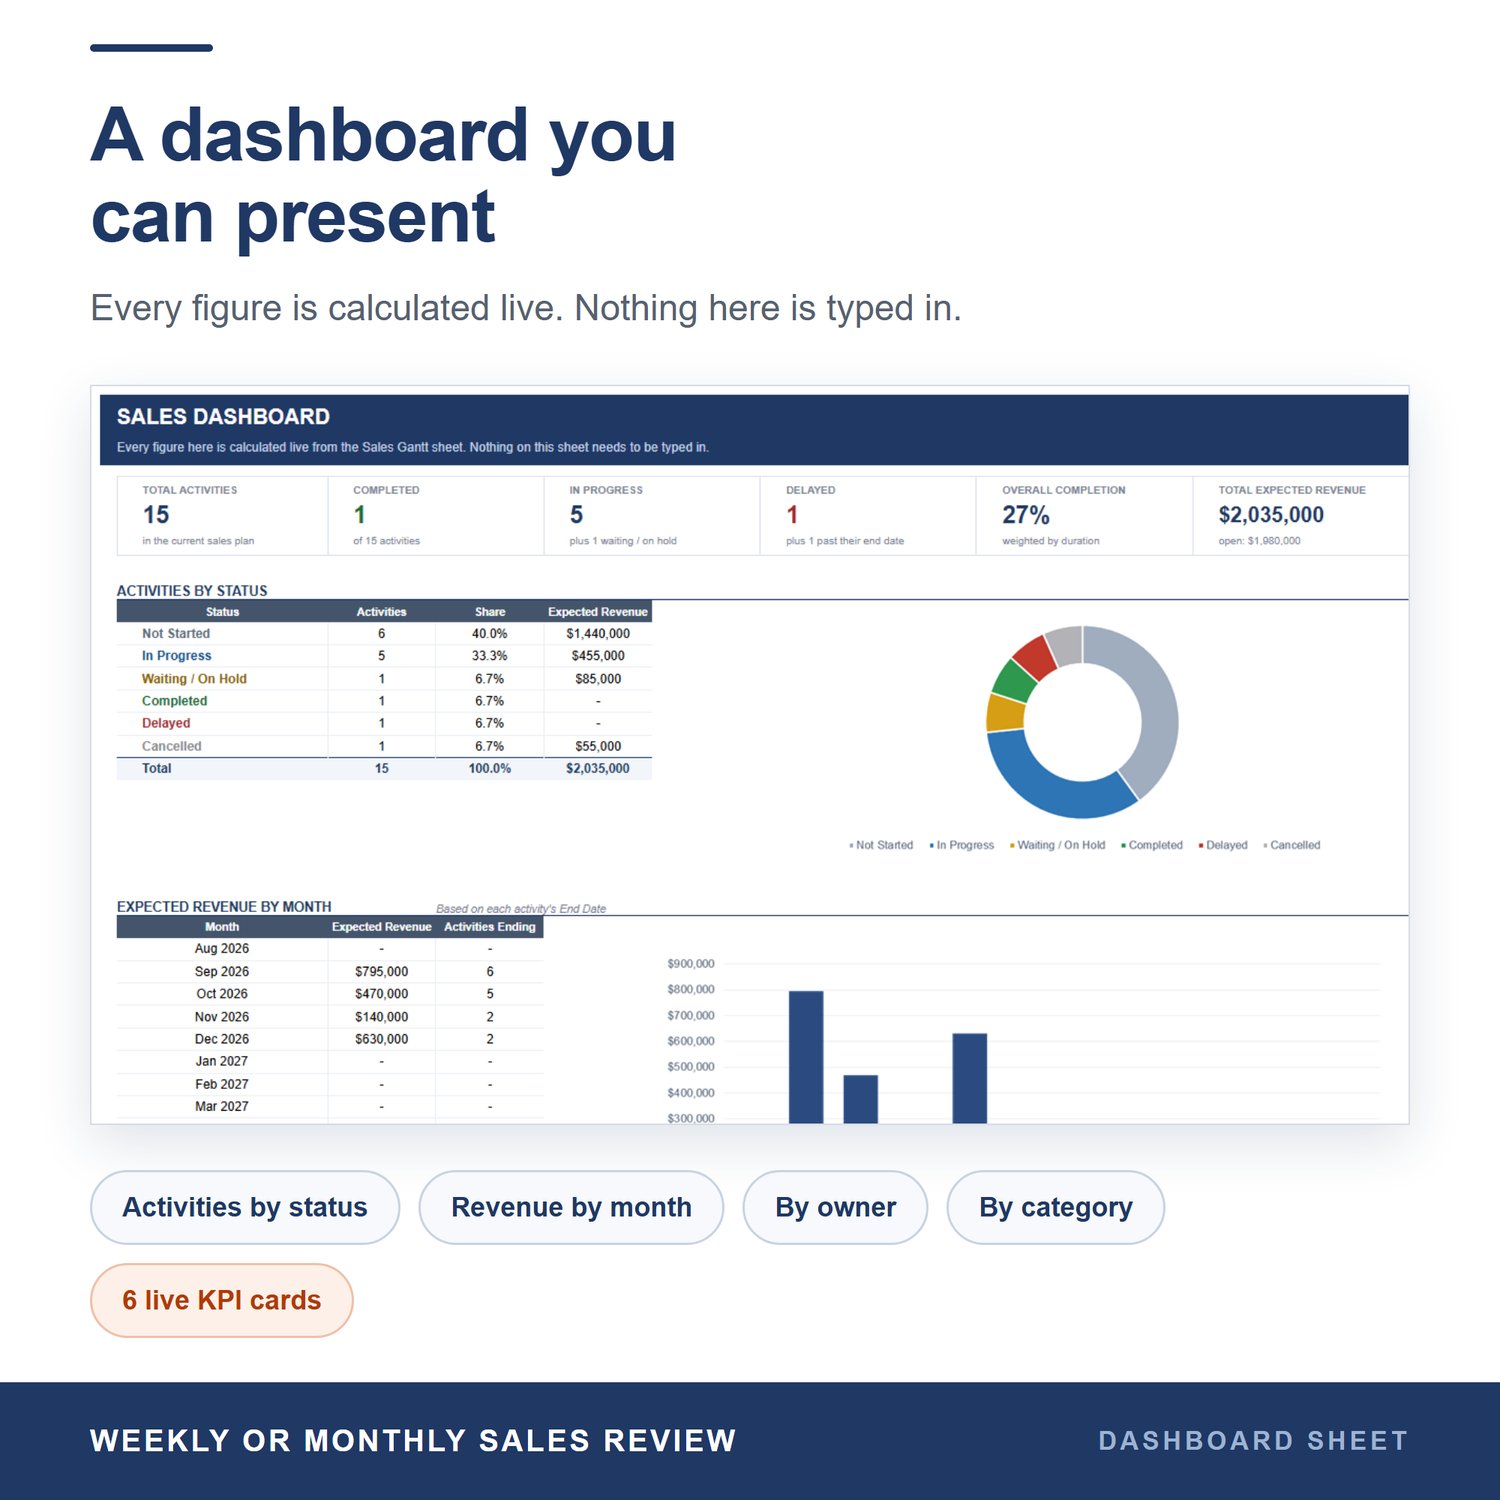
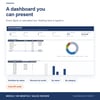
Six live KPI cards - total activities, completed, in progress, delayed, overall completion and total expected revenue - plus four clean charts: activities by status, expected revenue by month, activities by owner, and activities by category.
3. PIPELINE
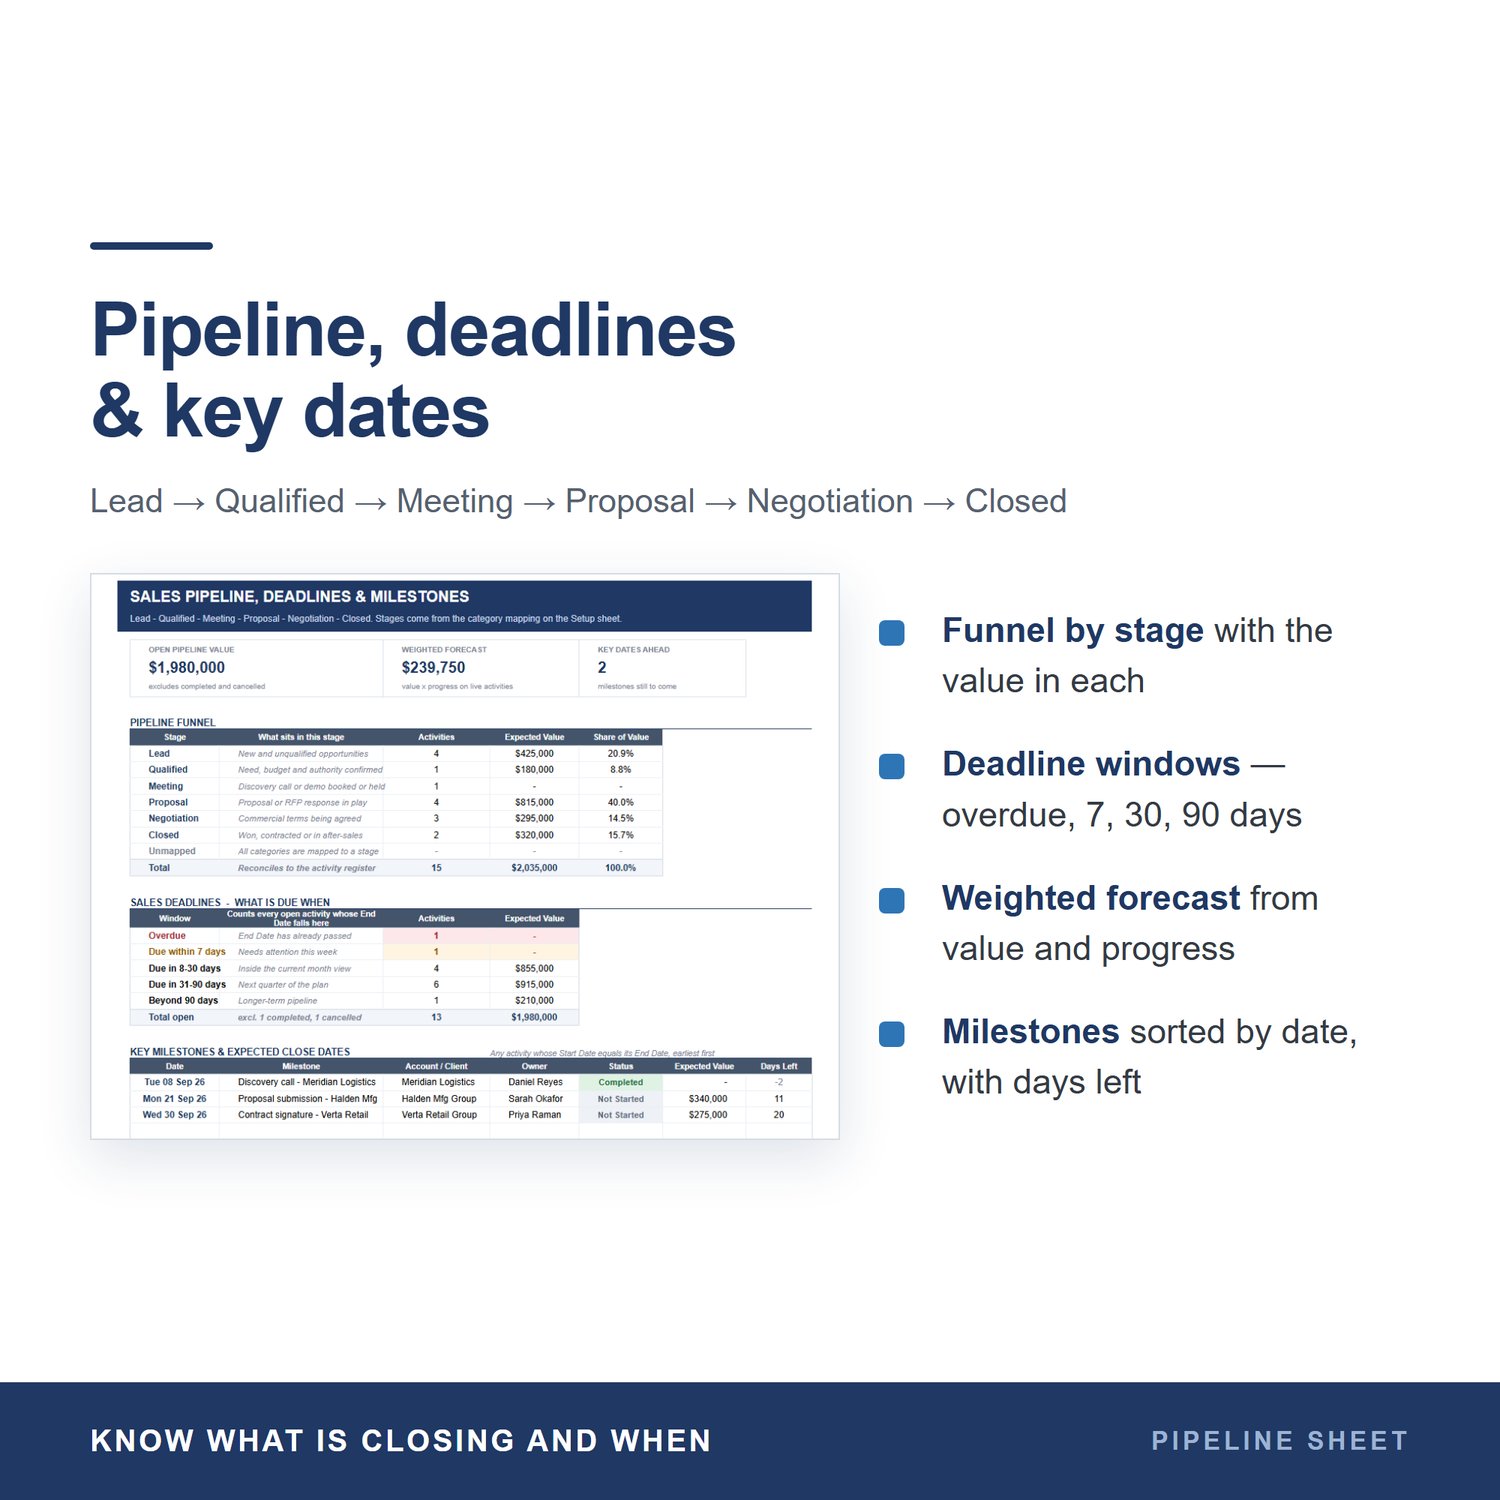
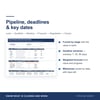
A Lead > Qualified > Meeting > Proposal > Negotiation > Closed funnel, deadline windows (overdue / 7 / 30 / 90 days), a weighted forecast, and a dated list of your milestones and expected close dates that sorts itself.
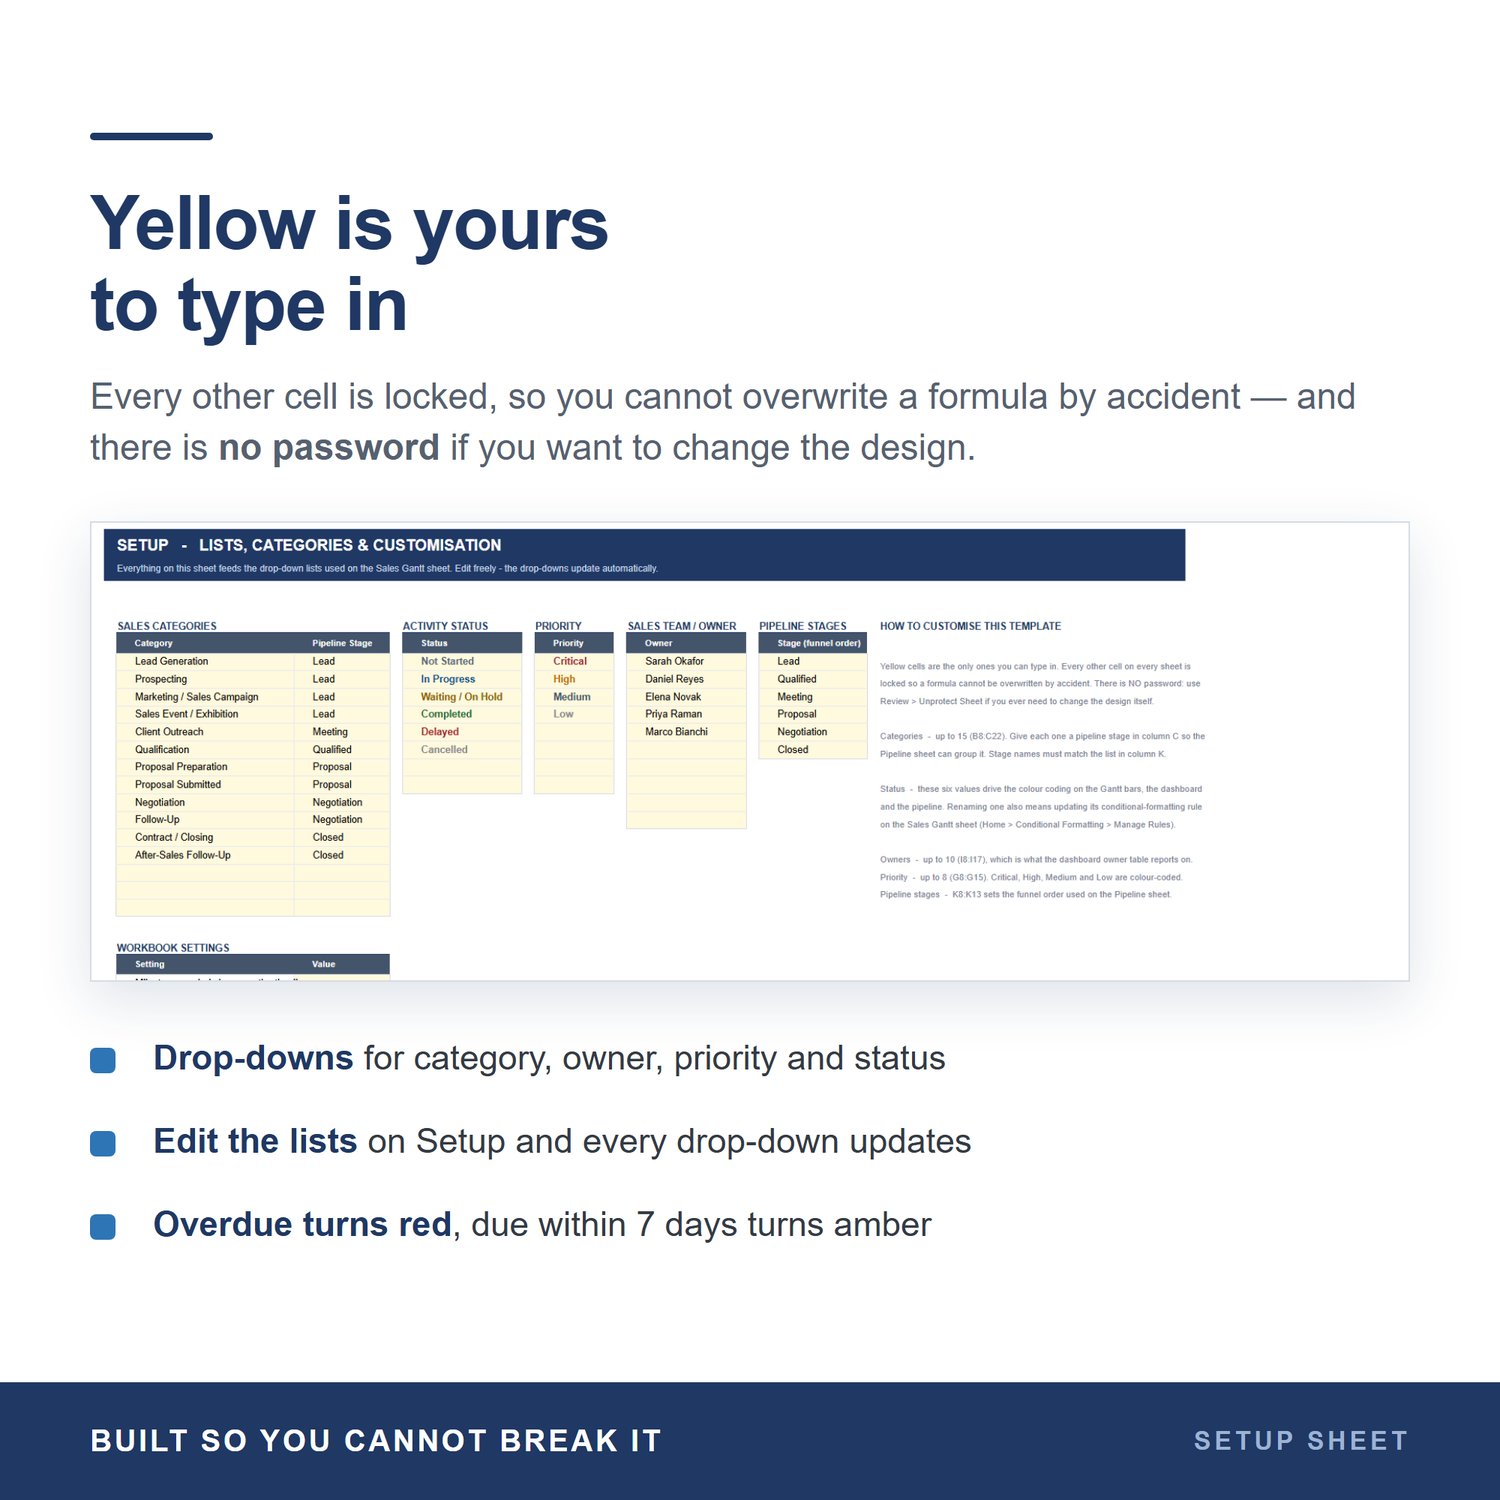
4. SETUP
Your drop-down lists - categories, statuses, priorities, owners and pipeline stages. Edit them and every drop-down updates automatically.
5. START HERE
A one-page guide and colour legend so you're running in five minutes.
IT DOES THE WORK FOR YOU
- Gantt bars build themselves from your dates
- Duration calculates automatically
- Overdue activities turn red, ones due within 7 days turn amber
- Cancelled work is struck through
- Colour-coded status and priority throughout
- Every dashboard and pipeline figure updates as you type
- Drop-downs, filters and frozen headers already set up
BUILT SO YOU CAN'T BREAK IT
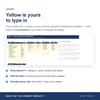
Yellow cells are the only ones you type in. Everything else is locked so a formula can't be overwritten by accident. There is NO password - Review > Unprotect Sheet if you ever want to change the design.
PERFECT FOR
Sales managers, account executives, B2B and SaaS teams, agencies, consultants, freelancers, small business owners, and anyone running a weekly or monthly sales review.
WHAT YOU NEED
Microsoft Excel (2010 or newer, including Microsoft 365 and Excel for Mac). This template uses conditional formatting, data validation and charts, so it is designed for Excel and is not optimised for Google Sheets, Apple Numbers or mobile apps. Please make sure you can open .xlsx files before buying.
HOW IT WORKS
1. Buy and download instantly - no physical item is posted
2. Open in Excel and read the Start Here page
3. Put your team on the Setup sheet
4. Delete the sample rows and enter your own activities
IMPORTANT
This is a digital download. Because of the nature of digital files, all sales are final and no refunds or exchanges can be offered. Please read the description in full and message me with any questions before purchasing.
For personal or single-business use only. Please do not resell, redistribute or share the file.
Questions? Message me any time - I'm happy to help you get set up.